










Most commentary on the Surface Laptop Ultra and the first wave of RTX Spark PCs from ASUS, Dell, HP, Lenovo, and MSI has focused on the machine. Is it a MacBook Pro rival? How long does the battery last? Can it game? Those are fair questions for a reviewer and the wrong questions for anyone deciding where AI spending goes over the next 3 years.
My view is that the October 7 launch is 3 bets packaged as 1 device. Microsoft and NVIDIA are betting that AI cost will migrate from a metered cloud bill to an owned asset on the desk, that the governance of autonomous agents belongs inside the operating system, and that the developer's laptop decides where production AI eventually runs. The hardware earns the headlines, but the bets will decide whether this category lasts, and each one carries different consequences for buyers, channel partners, and the two companies' rivals.
What was actually launched
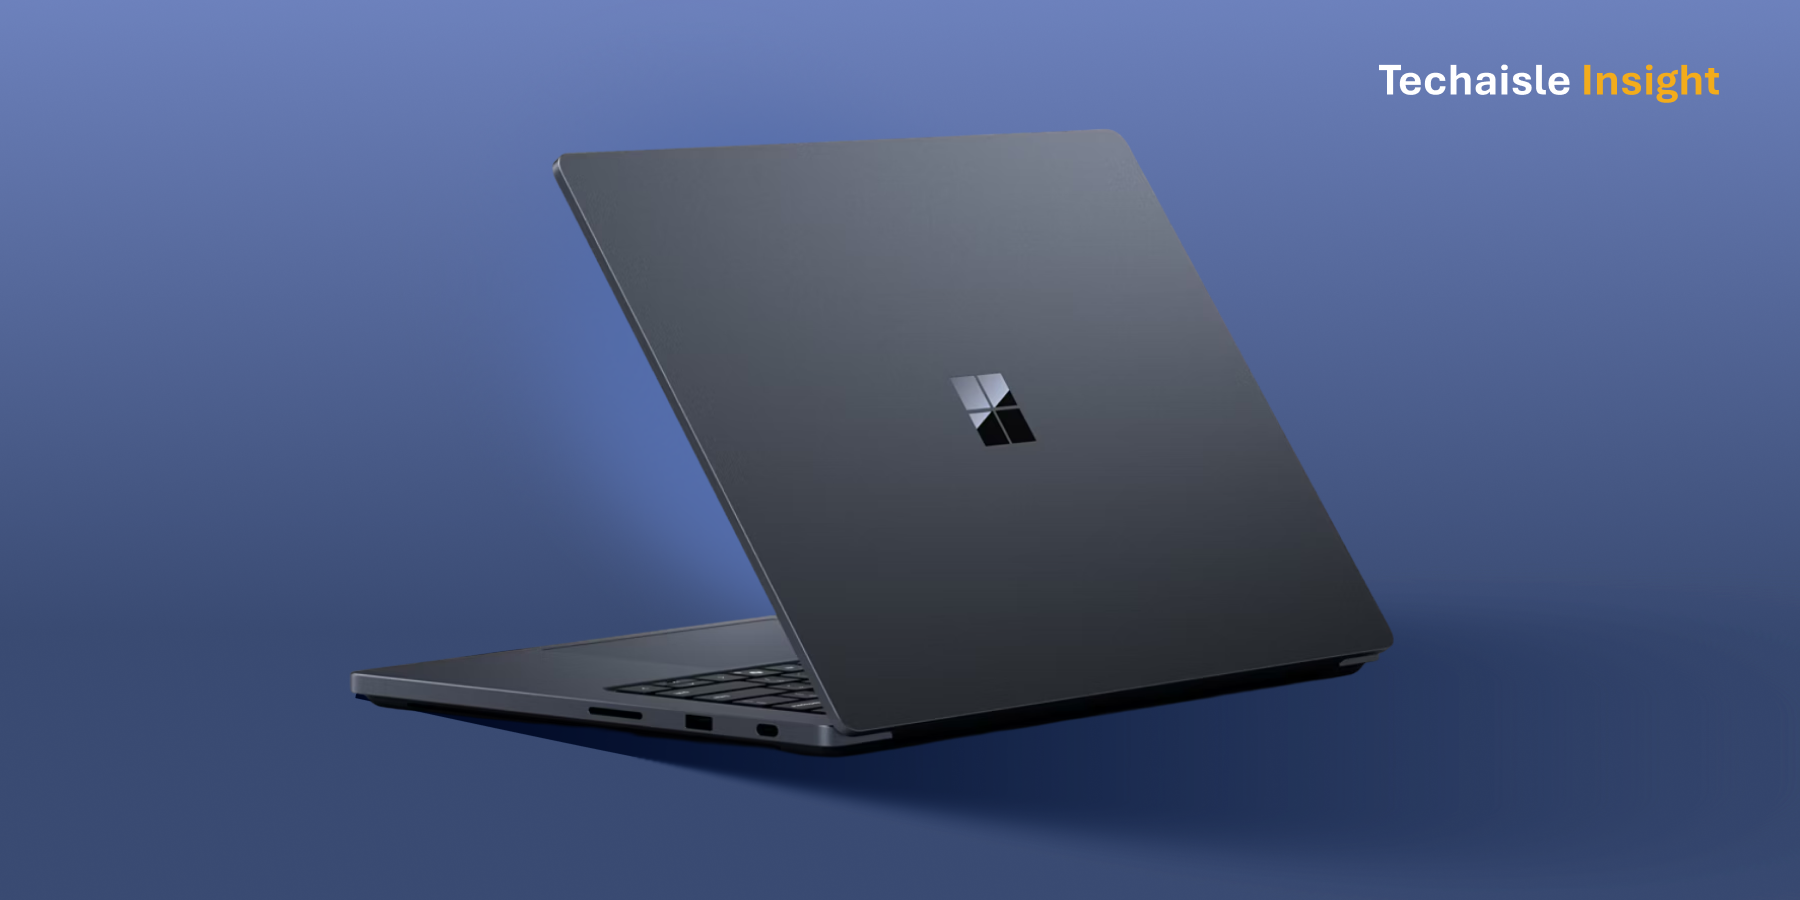
RTX Spark pairs a 20-core Grace Arm CPU with a Blackwell GPU carrying 6,144 CUDA cores, sharing up to 128GB of unified memory and rated at up to 1 petaflop of FP4 compute. The Surface Laptop Ultra starts at $2,599 and the Surface RTX Spark Dev Box at $5,999, with OEM laptops shipping from October 16. Alongside the silicon, Microsoft made Microsoft Execution Containers (MXC) generally available in Windows 11. MXC is a policy layer that defines which files and network destinations an agent can reach, and the operating system enforces those limits rather than the agent itself. GitHub Copilot, OpenAI Codex, OpenClaw, Replit and LM Studio already support it.
That paragraph of plain facts is where the real story sits.
Bet 1: Turning a metered bill into an owned asset