










Techaisle Analyst Insights
SMB and Midmarket AI Adoption Moves Through 4 Stages. Partner Supply Thins at Every One.
Most AI pilots do not stall because the technology failed. They stall because the buyer and the partner are standing at different points on the same path. Drawing on studies of SMB, midmarket, and channel partner populations, I built the AI continuum to show where those points are, what gets bought at each one, and how customers pay for it.
Three years ago I published a slide mapping how small and midmarket firms moved along the cloud continuum. It traveled further than almost anything else I have produced, mostly because people put it into their own decks and argued with it. I have now rebuilt it for AI and agentic adoption, because the questions vendors and distributors are asking me this year are the same questions they asked about cloud, and the honest answer is again that the market is not one market moving at one speed.
Here is the argument in a sentence. Demand exists at every stage of AI adoption. Partner supply does not. And the gap between the two widens the further right you go.
Continuum diagrams are usually somebody's hypothesis drawn neatly. This one rests on Techaisle's 2026 survey programs across small business, midmarket, and channel partner populations, running to thousands of respondents globally, and on the qualitative work around them: structured interviews, vendor and distributor briefing sessions, and a large number of unstructured conversations with buyers and partners. The surveys established the stages and the volumes. The conversations established the sequence, and sequence is the part a questionnaire cannot reach.
Why a continuum instead of a maturity model
Maturity models rank companies. They tell a vendor which customers are ahead and which are behind, which is a comfortable thing to know and a useless thing to sell against. Every maturity model ends up recommending that the laggards catch up.
A continuum does something different. It maps what a customer actually buys at each stage, who they buy it from, and how they pay for it. That turns the picture into a route. A partner can look at a continuum and see the specific line item they are missing. A vendor can look at it and see which stage their program is funding and which stage their marketing is describing, and those are frequently not the same stage.
The version I have built runs on the same spine as the original: partner entry point across the top, partner revenue flywheel through the middle, end-point on the right, current state to future ready along the bottom. Four stage columns, with five layers of data underneath each one.
The midmarket path
The midmarket, 100 to 4,999 employees, moves through four stages.
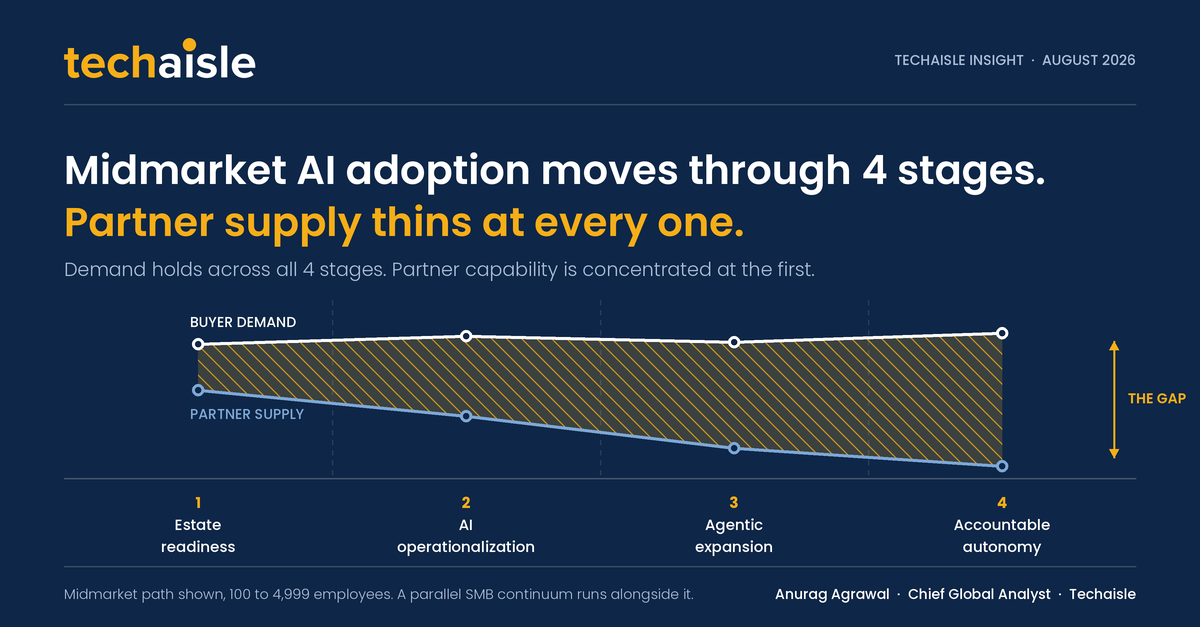
Estate readiness is the foundational work that AI demand exposes rather than creates. Identity and access modernization, network and edge readiness, data hygiene, storage placement. Nobody buys this because they want it. They buy it because their first serious AI workload will not run without it.
AI operationalization is the move from something that works in a demo to something that runs in production with an owner, a budget line, and a measurement. This is where the Operationalization Premium sits, and it is the largest single pool of addressable work in the next 24 months.
Agentic expansion is where the customer stops asking AI to produce output and starts asking it to complete steps. Workflow orchestration, remote file orchestration, integration into systems of record, human review at the boundaries.
Accountable autonomy is the end-point. The agent acts inside a defined perimeter, its actions are logged, its authority is capped, and somebody has signed up to be answerable for what it does. Very few customers are here yet, though a meaningful number are already asking for it.
The SMB path is a different path, not a smaller one
This is the correction I would most like the market to absorb.
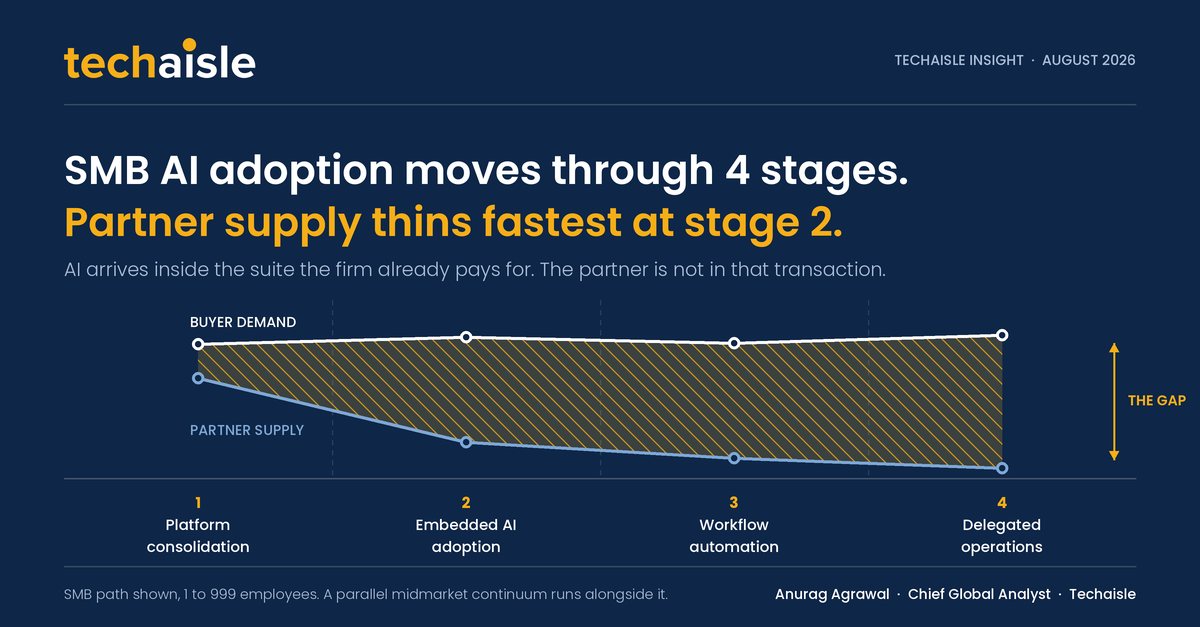
Small business AI adoption is routinely described as the midmarket path with lower numbers, which gets the mechanism wrong at every stage. Small firms move through platform consolidation, embedded AI adoption, workflow automation, and delegated operations, and the mechanism at each stage is different from the midmarket equivalent.
The clearest example is how AI arrives. In the midmarket, AI capability is generally a purchase decision with its own evaluation and its own budget. In the small business segment, most of it arrives inside a suite subscription the firm is already paying for. For a 40-person company, prebuilt agent templates show up in stage 2, bundled, at no incremental decision cost. Any model that treats them as an advanced capability will consistently misread where small firms actually are.
There is a measurement point underneath this that matters to anyone sizing the opportunity. If you weight the later SMB stages by firm count, agentic demand looks negligible, and you conclude the segment is not ready. Weight the same stages by addressable IT spend, and the picture changes materially. The small number of small firms buying delegated operations are not representative firms.
They are disproportionately the ones with money.
AI is the demand trigger. The estate is the delivery surface.
Across both continuums, roughly 40% of the work at any given stage is not AI work at all. It is foundational estate work that the AI initiative surfaced, funded, and made urgent.
I want to be careful how this is read, because it runs counter to how the category is being marketed. AI demand is why the estate finally gets fixed, and a partner who declines the estate work to hold out for the interesting AI work will lose the account to someone who took the unglamorous line item first. The estate work is the entry point. It has been the entry point in every technology transition I have measured, and this one behaves the same way.
How the customer pays at each stage
The continuum carries a tokenomics band because how the customer pays changes as they move right, and almost nobody has priced for it.
At the left, the customer pays per seat, which is predictable and which partners know how to resell. In the middle, consumption enters, and the customer's bill starts to vary with usage they do not yet know how to forecast. At the right, the conversation turns to committed capacity and outcome-based structures, where somebody has to carry variance risk.
The partner economics have not moved with this. A partner selling stage 3 and stage 4 work on a stage 1 revenue model is absorbing token variance that was never priced into the engagement. That is Token Shock arriving through the services line, and it is the quiet reason several partners I have spoken with this year have profitable AI revenue and declining AI margin at the same time.
Where the supply actually is
The demand layer and the supply layer are deliberately drawn on the same axis, because the distance between them is the finding.
Partner supply concentrates on the left. It thins through the middle. On the right, it is nearly absent. The reflexive explanation is skills, and skills are part of it. But the constraint at accountable autonomy is commercial. Being accountable for what an autonomous system does inside a customer's environment means underwriting an outcome, and the overwhelming majority of the channel has no mechanism to price risk, no balance sheet to absorb it, and no insurance product to transfer it. Training will not fix that. Program design might.
Over the next 24 to 36 months, the midmarket center of gravity moves right by roughly one full stage. The supply curve only moves if vendors and distributors deliberately fund the stages where nobody is standing, which means paying partners to build capability at stage 3 and stage 4 rather than continuing to compensate the stage 1 motion that already works.
The continuum measures where the money currently sits and where the capability does not. Whether those two converge over the next three years is a decision vendors and distributors get to make, not a trend anyone can wait out.
What the full continuum contains
The diagrams above are one layer of a larger instrument, flattened for publication. The working version runs both segments side by side, midmarket and SMB, across all four stages, and carries five measured layers at every intersection.
Demand, sized by stage. Partner supply, meaning the capabilities partners deliver in production today. Composition, the split between AI work and the foundational estate work that arrives with it. Tokenomics, how the customer actually pays at that stage as the meter moves from per seat to consumption to committed capacity. And direction of travel, where each segment's center of gravity sits 24 to 36 months out.
Underneath each stage sit the priced line items, where most of the practical value lies. Identity and access modernization, network and edge readiness, data hygiene and storage placement, workflow and remote file orchestration, output validation, and ongoing AI FinOps. Each carries its own demand figure and partner attach rate, which is what makes a stage sellable.
Running through it all is the commercial spine: where a partner enters, what the revenue flywheel looks like once they are in, and where the engagement ends up.
It draws on Techaisle's 2026 research programs across buyers and the partner ecosystem, quantitative and qualitative, formal studies and the unstructured conversations that establish sequence. Vendors use it to test whether their partner programs are funded at the stages where capability is actually missing. For distributors, it works as an enablement targeting tool, and partners tend to use it to find the line item their offer does not yet have.
If that is useful to your planning, get in touch.
When you subscribe to the blog, we will send you an e-mail when there are new updates on the site so you wouldn't miss them.