











Techaisle Analyst Insights
Techaisle Channel Survey: Why Small Partners Grow at Half the Rate of Big Ones
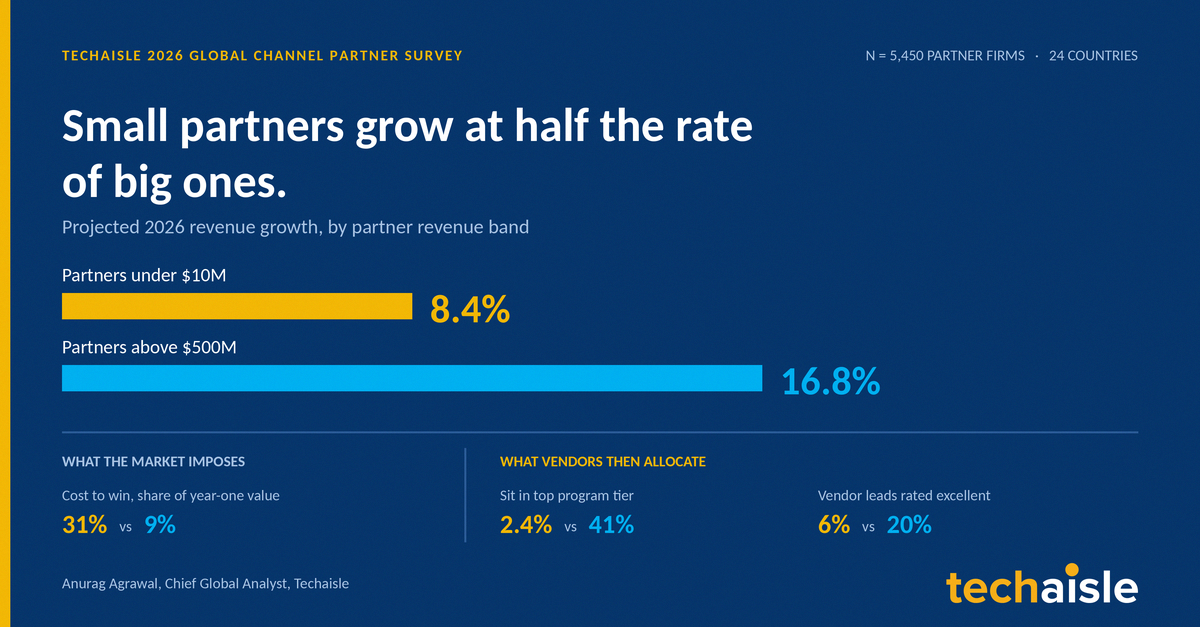
Techaisle’s 2026 Global Channel Partner Survey ran across 5,450 partner firms in 24 countries, and buried in the revenue-band cuts is a number that belongs on the first slide of every channel planning session next quarter. Partners under $10M project 8.4% revenue growth for 2026. Partners above $500M project 16.8%.
Some of that gap is simply the shape of the market. Smaller firms carry less capital, chase smaller deals, and cannot hire their way into a new practice on a quarter’s notice, and no program will change any of that. But the survey makes something more useful visible when it cuts the data by revenue band. The market disadvantages are not acting alone. Sitting on top of them is a second layer of disadvantage that vendors build and control directly, and that layer is currently compounding the first rather than offsetting it. Separating the two is where the opportunity is, because one of them can be fixed.
The Market Tilts the Field Before Any Vendor Acts
Deal economics tilt it first. Customer acquisition cost consumes 31% of first-year value on deals below $25K and 9% on deals above $2M, and 67% of sub-$10M partners operate in the $25K to $100K band. A small partner therefore spends 3.4x proportionally to win the only deals its size permits it to chase. No vendor set that ratio. It falls out of the arithmetic of selling.
Practice economics tilt it again. Security revenue averages 18% at the largest partners and 10% at the smallest, not because small firms want to offer security practices less but because a practice does not become commercially viable below a certain team size. AI is tracking the same curve, with 37% of $500M+ partners reporting an AI-security pipeline above a quarter of their total against 13% of sub-$10M partners. 60% of the channel names talent as the primary constraint on scaling AI, and hiring is the one lever a 40-person firm cannot pull on demand.
None of that is any vendor’s fault. All of it is the condition a partner program encounters on arrival, and the only question that matters is what the program then does about it.
Then Vendors Allocate on Top of the Tilt
Here the survey stops describing the market and starts describing decisions.
Tier position is the clearest case, since it governs access to most other benefits. 41% of partners above $500M sit in the top tier of their primary vendor program, against 2% of partners under $10M. Over the last 24 months, the smallest firms have been moving down in tier more often than up, while the channel as a whole moved up, which leaves the smallest band as the only one running negative. Vendors control tier thresholds, basing them on transaction volume and deal size, the exact metrics structurally out of reach for smaller partners.
Lead quality is the next, and it sits somewhere vendors rarely think to look. 20% of $500M+ partners rate the leads their vendors send as excellent, and 6% of sub-$10M partners do. These are the same vendors running the same demand generation engines against the same qualification criteria. If the machine is identical and the output is not, the difference is in who gets which leads. Sometimes that is a routing decision somebody makes by hand, but increasingly it is the new AI-enabled partner portals routing leads automatically on historic performance, which quietly hard-codes yesterday's allocation into tomorrow's. Concierge support follows the exact same shape: the partners who most need high-touch support to absorb program complexity are the least likely to receive it.
The Top Tier Is Where the Investment Goes
Partner programs have grown more sophisticated about how they define value. The leading frameworks now score partners on capability, lifecycle and managed-services motion, and customer engagement rather than transaction volume alone, and that shift is real. But it runs into a structural limit that the revenue-band data exposes. The richest benefits, the co-sell motions, the concierge access, the marketing investment, the executive attention, concentrate at the top tier, and the top tier is the same one the earlier numbers showed is nearly closed to small partners. A small partner can score well on every value metric a program tracks and still sit two tiers below the investment, because the tier tracks scale more faithfully than it tracks the customer value the metrics claim to reward.
The largest partners in the survey run nearly 20 vendor programs simultaneously; the smallest manage about five. This is a resource gap, not a commitment gap. A firm managing 20 programs employs dedicated alliance headcount to clear thresholds, chase incentives, and attend every QBR. A small firm cannot, yet it competes for tier status against those that do. The loop closes on itself: better tiers and leads flow to the fastest-growing partners, who then grow even faster, justifying next year's allocation based on evidence the allocation itself created. Every constraint on the smaller firm is either arithmetic or policy. The arithmetic is nobody's choice. The policy is somebody's, and it can be changed.
The Case for Allocating to Big Partners, and Why It Fails
Vendors have a serious defense for concentrating investment this way, and it deserves stating properly rather than as a straw man. Vendors allocate finite leads, finite partner-manager hours, and finite funding to the partners most likely to convert them, which is ordinary capital allocation and would be close to negligent to do otherwise. Small-partner coverage is what distribution exists for, and a vendor spreading direct investment evenly across the long tail is simply buying less pipeline with the same money.
The logic is sound for any single decision. It breaks down when you look at all those decisions together, for two reasons.
The first is that the conversion evidence is self-fulfilling. As established, the input quality helps produce the output, which then justifies tomorrow's allocation. But the flaw runs deeper than a self-closing loop. A surprising number of vendors cannot produce per-partner conversion data by revenue band at all, which means their allocation never rested on evidence in the first place. It rested on the assumption that the biggest partners convert best, quietly arranging the inputs to prove it.
The second is that coverage is not fungible. Distribution moves product efficiently, but it does not build a security practice in a secondary city, and it does not hold a vertical relationship that took nine years to earn. Small partners exist in an ecosystem to reach the mid-market account a $500M integrator will not staff, the geography that never appears on a top-50 list, and the vertical whose entire addressable spend supports exactly one 40-person firm. Starve that layer, and it will not escalate or complain. It quietly reallocates its attention to whichever vendor’s thresholds it can clear, and the vendor finds out two years later, when regional coverage has thinned without anyone having decided that it should.
Two Moves That Cost a Vendor Almost Nothing
This is not an argument for spreading investment thin, which the vendor's own defense already rules out. It is an argument for two specific moves that cost almost nothing. Ring-fence a fixed share of qualified leads for partners under $10M, hold it for four quarters, and compare the conversion rate against the assumption that justified routing those leads to larger partners in the first place. That one experiment settles the question in either direction. And build a route into the top tier that a genuinely excellent small partner can actually travel, denominated in the customer outcomes the best programs already track, rather than one that runs exclusively through transaction volume. Neither move requires a program redesign. Both are defensible on the vendor's own numbers.
The channel is not confused about what is happening, and it says so most sharply where a vendor would least like to hear it. The single thing ISVs most want vendors to stop doing is prioritizing the largest 50 partners over everyone else. Consultants rank the same complaint third. VARs rank it ninth, which reads less as disagreement than as a difference in aspiration, since a good number of VARs still expect to join that 50. The partner types carrying the most differentiated capability are the ones most convinced that differentiated capability is not what gets rewarded.
The Average Hides the Only Split That Matters
The average partner will grow 11.1% next year, and that average conceals far more than it reports, because it averages two populations traveling at very different speeds. Part of the distance between them is structural and will not yield to any program change. Part of it is allocated, and that part gets decided quarterly, in lead routing meetings and tier threshold reviews, by people who in most cases have no idea they are deciding it.
Any vendor willing to cut the data by revenue band will find out how large their allocated share is. The ones who never look will keep funding the partners who need funding least, and keep describing the outcome as a meritocracy.
Most will not look, and small partners should plan on that rather than wait for it. The winning move is depth, not breadth. Pick two or three vendors whose economics actually favor small partners, and go deep enough to matter to them, instead of spreading thin across a roster that will always rank you ninth. Build one differentiated practice, in AI or migration or wherever the demand is real, that changes the conversation from what did you resell to what can only you do. That practice is the one asset a vendor cannot allocate away, because the partner owns it. The gap is real and mostly outside any single partner's control. What is inside their control is refusing to compete on the axis the big firms always win, and choosing the one they cannot.
When you subscribe to the blog, we will send you an e-mail when there are new updates on the site so you wouldn't miss them.