Look back
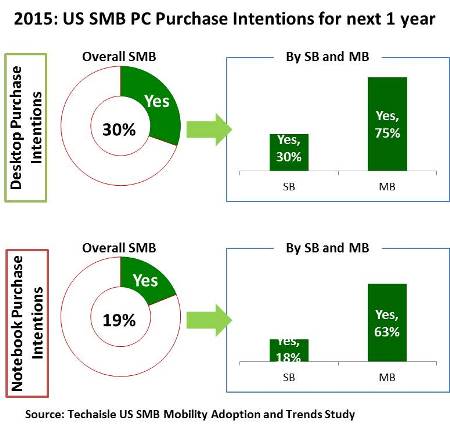
As is the case in each year’s SMB research, Techaisle SMB survey respondents are asked to detail their plans for acquisition of different types of client devices. Two of the major categories investigated by the surveys are desktop PCs and notebook PCs. To establish a baseline understanding of PC use and demand, Techaisle asks SMB respondents to specify the number of endpoint devices that are currently in use within their companies, and then asks them to specify the quantity that they are planning to buy over the next twelve months. To provide actionable insight to our clients, the question asks separately about desktop PCs, notebook PCs and tablets. While 2016 survey is in the field it is worth looking at the trends of last two years. In 2014, both the US small and midmarket businesses were bullish about new desktop and notebook purchases. But in 2015, the percent of US SMBs planning to buy PCs had dropped by 40% from 2014 for both desktops and notebooks. However, although the average number units of desktops planned to purchase dropped from 2014 to 2015 the average number of notebooks planned to purchase increased substantially from 2014 to 2015.
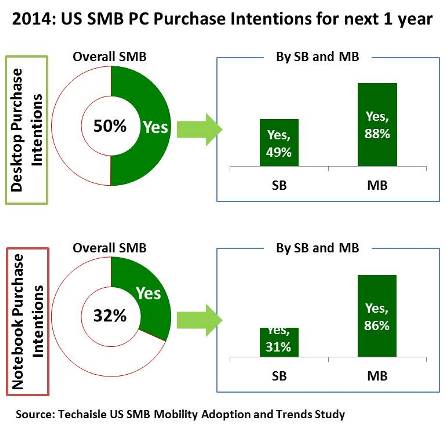
Many desktop buyers were motivated to replace existing units because they were reaching end-of-life and take advantage of Windows XP upgrade path. Desktops are also more of a planned/budgeted item than other client form factors (notebooks, tablets), meaning that desktop acquisitions are more likely to appear in formal purchase plans than the mobile units, and less likely to be acquired on an ad hoc basis. Notebooks are usually ad hoc purchase items – meaning that they would be underrepresented in research of this sort relative to desktops. Additionally many users upgrade their notebooks over time (to replace damaged units, to get features like touchscreen, to obtain lighter or smaller products, etc.).
However, corporate purchase intentions do not provide a complete perspective on mobile device acquisitions.
Potential Impact of BYOD on US SMB PC Purchases
Figure below presents a perspective on corporate purchase plans and the impact of employee purchases of notebooks. The top two sections of the table, shaded in green, illustrate the proportion of businesses by employee size reporting desktop and/or notebook purchase intentions, and the number of units that they plan to acquire. These figures are used to prepare a “net increase” figure – the average number of new units expected to be deployed by businesses in each employee size category. These two grey sections are followed by a line of percentages, shaded in purple, which shows the ratio of corporate desktop purchases to corporate notebook acquisitions. It shows that microbusinesses with 1-9 employees are much more likely to be buying desktops than notebooks, and that other SMBs are planning to buy 25% to 99% more desktops than notebooks.
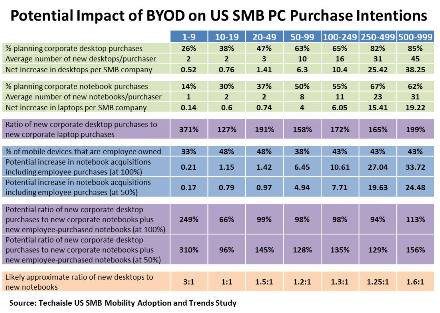
The next section of the table, shaded in blue, begins with the BYOD penetration statistics that appear at the bottom of the figure. It then calculates the impact on notebook purchase intentions if this ratio is fully reflected in notebook purchases (the “at 100%” line) and if employees were to buy notebooks at half of the BYOD penetration rate (“at 50%), showing both corporate and employee purchases of these devices. These revised figures are used to calculate the desktop to notebook PC purchase proportions shown in the second set of purple-shaded cells. Here, we see that if employee purchases of notebooks are equivalent to current BYOD penetration levels, new notebook units would be about equal to new desktop purchases in most employee size segments, while a 50% scenario would result in ratios ranging from about 1:1 to 1:6 in all but the smallest employee size category.